A Math-er of fact
*Filed under: I better write this down before I forget how I did it.
A co-worker at a previous workplace came to me with a problem they were working on. They needed a skewed pseudorandom number generator that, for a given range, would return numbers at the end of the range more often than numbers at the start.
We had no other requirements, nor a definition of what 'more often' should mean, so there was free reign to come up with the algorithm ourselves.
We did a few attempts at hand crafting some pretty awful solutions, involving conditional statements based on the results of other random numbers. They were pretty poor solutions. Deep down I knew there was a more mathematical solution somewhere.
It wasn't until I decided to draw what I needed as a graphical representation that I had an insight into a better solution. I needed a function f(x) that created an end result that was more likely to be a larger value than a smaller one. In graphical terms, for any input on the x-axis, my "randomised" (y) value would lie on the following graph:
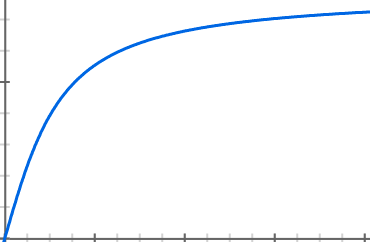
Here, for a uniformly spaced value of x the value of y is skewed towards the upper bounds, while still resulting in low values occasionally getting through if the value of x was sufficiently low. Now all I had to do was create an algorithm that could replicate this graph.
Reinventing the wheel
Did I say create? I mean find. There is absolutely no need to try to create such a curve when they probably already exist in nature. This graph is pretty simple, there's surely an easily calculated function that will approximate what I want.
Any time you're dealing with curves you should be thinking of two things, π and trigonometry. They are everywhere in nature and just because what you're looking for isn't an obvious application of trigonometric functions doesn't mean you should discount it.
For example, here's sin(x):

That's not bad, the curve starts off steeply, but it's a little too uniform for my tastes. Also, this curve is mirrored, it will descend and repeat periodically. We want a curve that will stay high no matter the range.
Without turning this blog into a treasure trove of trig-y curve-y goodness, I'll cut this short. The answer (as I require it) doesn't lie in trigonometric functions, it lies in inverse trigonometric functions. Specifically the inverse of tan(x), or arctan(x) as it is also known. In many C based libraries, it is usually called atan(x).

arctan(x) is bounded in the range (-π/2, π/2) for values of x in the range (-∞, ∞) so our solution will need to restrict itself to non-negative values of x. For values of x in (0, ∞) the value of arctan(x) is bounded in the range (0, π/2).
Dividing by π/2 will give us a normalised value of y between (0, 1) which we can now use to generate our skewed random numbers. Here are two different random number generators, one is for your standard uniform distribution, the other a skewed distribution which should favour higher numbers.
Plugging this into a playground, like so
results in the following output
uniform distribution [0, 1, 1, 1, 1, 1, 2, 2, 2, 3, 3, 3, 4, 4, 5, 5, 5, 5, 5, 6, 6, 6, 7, 7, 7, 8, 8, 9, 9, 9]
skewed distribution[0, 0, 5, 5, 5, 5, 7, 7, 7, 7, 7, 8, 8, 8, 8, 8, 8, 9, 9, 9, 9, 9, 9, 9, 9, 9, 9, 9, 9, 9]
Good enough for me.
This wasn't the final algorithm we settled on, we found that the higher values were appearing way more often than we liked, but with a little tweaking we softened the curve a little to give the lower values more of a fighting chance. But the overall idea is what you see here.
Shoutout to my parents for spending a fortune on my Mathematics degree, just so I could one day do this one tiny thing.